Our “third-world” state: revisiting herbarium specimen density in Nevada
Herbarium specimens remain the most reliable method for the documentation of plant biodiversity. As opposed to photographs or unvouchered reports, all details of a vouchered species’ morphology and often DNA are reviewable by experts, and specimens can remain in useful condition for hundreds of years with proper housing and care.
The number of herbarium specimens collected within a given area can indicate how well-studied that area is botanically. This holds true across spatial scales; we could conclude that a small park or an entire county is well-studied botanically if either had a relatively high density of herbarium specimens expressed in the same spatial units.
Some places are more intensively collected than others. The question of what has driven historical collecting behavior is complex, but analyses of large datasets indicate that collectors are likely to collect near roads and closer to population centers and herbaria and from localities already sampled by other collectors (Daru et al. 2017, Schmidt et al. 2025). Although it is common to assume that most plant biodiversity has already been documented, it is a certainty that many taxonomic and distributional novelties remain undescribed (Ertter 2000).
Analyzing the density of herbarium specimens collected in a given area, then, can help us understand places that may have been overlooked and that deserve further attention—maybe in the form of NNPS field trips, collecting efforts, and support for local herbaria.
One of the few systematic studies of herbarium specimen density that includes Nevada is a paper published by the California botanist Dean Wm. Taylor in 2014 which compares herbarium specimen density by county for the entire western United States. In that study, Nevada (referred to by Taylor as “relatively a ‘third-world’ state” with regard to specimen density) looks like it might be exactly the kind of backwater that most of the country imagines when they think of our beautiful state beyond the Las Vegas Strip, if they think of it at all—something between The Hills Have Eyes and Tattooine. I don’t recall either Papa Jupiter or the Jawas displaying any interest in botany, although their penchant for exploration and scavenging does demonstrate a certain spiritual kinship with botanists.
Taylor’s study provides a valuable snapshot of the state of herbarium data at the time:
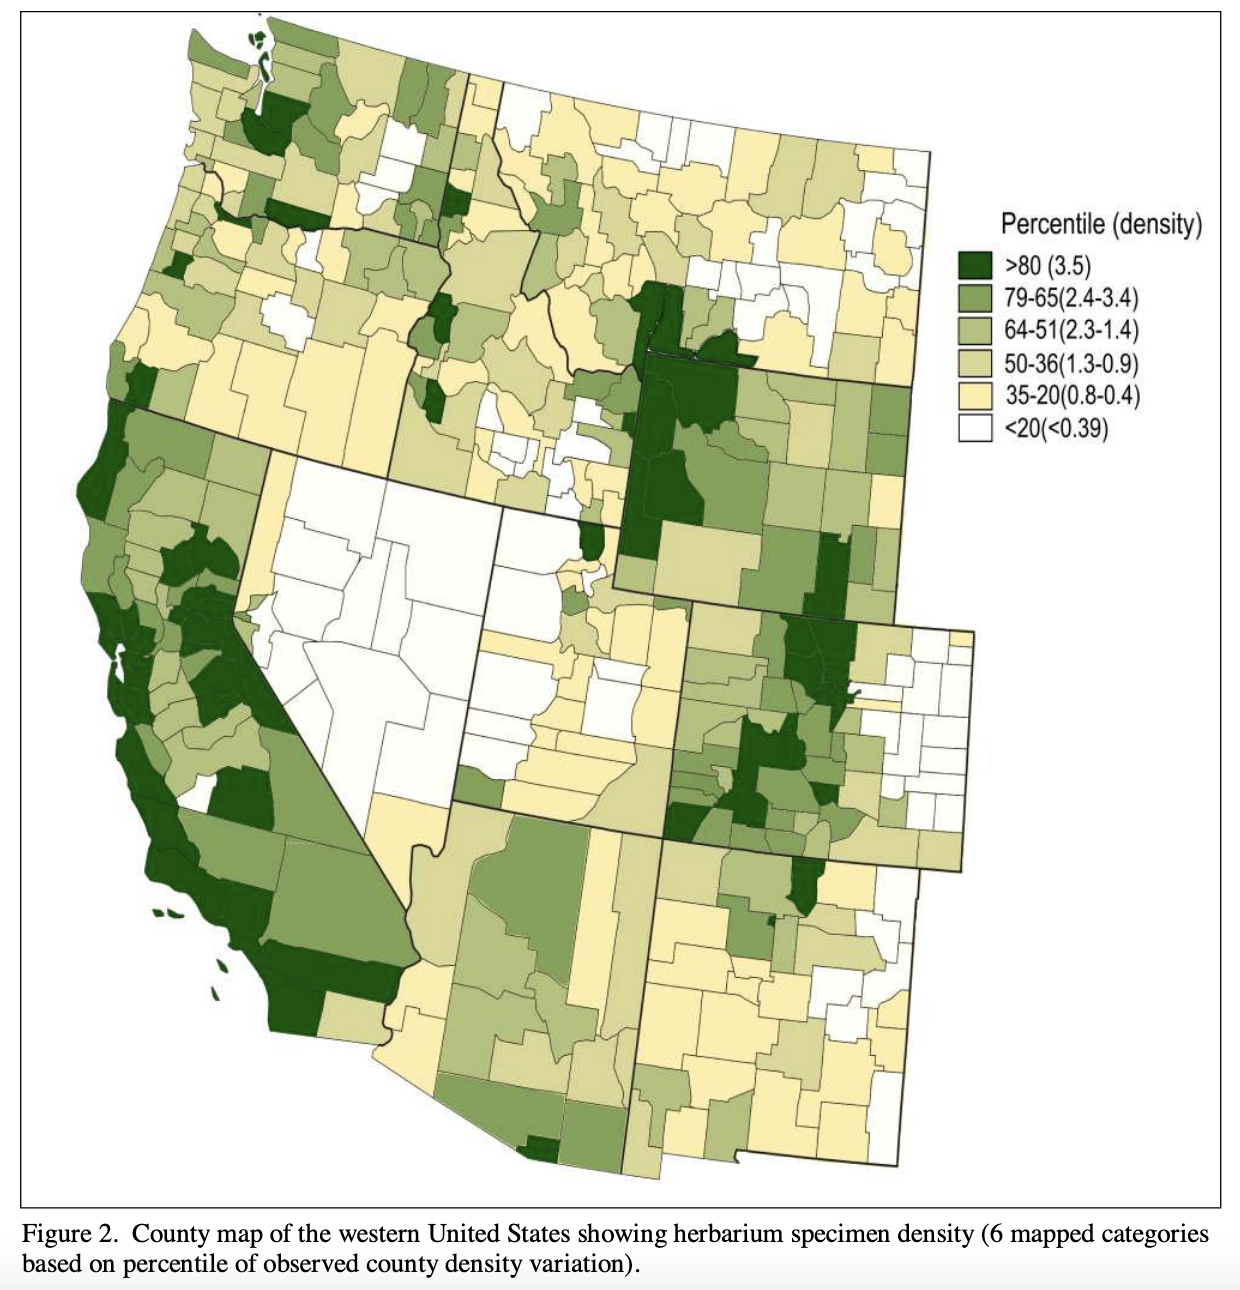
The Rockies, the Sierra, and the California coast are remarkably well-collected—no surprises there—but Nevada’s borders still stand out with a low density of specimens even compared to adjacent less-popular locales like southeastern Oregon, northwestern Arizona, and the California deserts. Taylor’s study comes with caveats, chief among them the fact that many Nevada specimens housed at the RENO and UNLV herbaria remained undigitized in 2014. I’m not sure what level of progress other western states had made in digitizing their collections by that time, so it’s possible that Nevada shouldn’t be singled out for missing data at the time of Taylor’s publication. Note that the figure uses a somewhat arbitrary classification of specimen density by percentile, which I have roughly replicated in newer figures below.
Given the progress in specimen digitization over the past twelve years, I thought it might be of interest to update Taylor’s analysis. I downloaded all SEINet records for vascular plants in Nevada and deduplicated the records by filtering out those with identical values in the species, collector, date, and locality fields. This method should not be considered robust due to inconsistency across herbaria in transcribing information from labels (e.g. duplicates of the same collection may have the collector recorded as “Tiehm & Nachlinger” by one herbarium, “A. Tiehm et al.” by another, and simply “Tiehm” by a third), but it is fine for a preliminary look. Although SEINet returns records from a wide array of herbaria, Taylor queried more herbarium databases than I did, so it is possible that my dataset is missing records that his dataset includes.
Specimen density in Nevada counties has changed a bit since 2014:
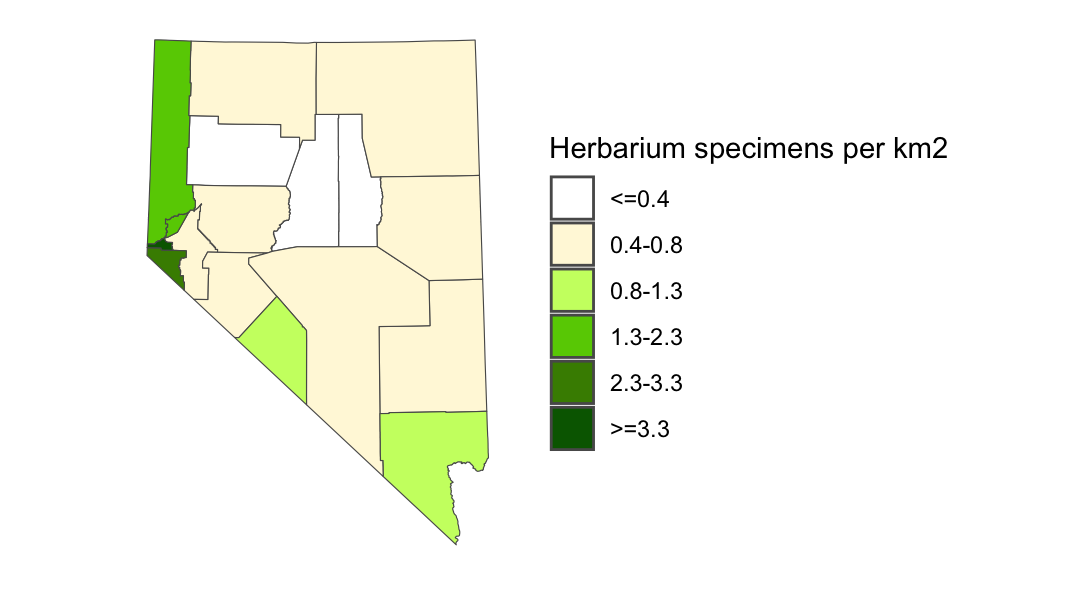
Proximity to Reno and the presence of our tiny strip of the Sierra Nevada continue to be factors associated with the highest rates of specimen density, and northern Nevada houses the only counties with a density of > 1.3 specimens per square kilometer. The Sierra contain a disproportionate percentage of the state’s plant diversity, and Reno’s land-grant university and active Native Plant Society have hosted an active community of collectors. Clark County contains both the population center of Las Vegas and the well-botanized Spring Mountains, which are again disproportionately diverse and home to many rare and endemic species. The increase in specimen density in Esmeralda County, one of the state’s more isolated corners, can likely be attributed to intensive collecting in the Silver Peak Range and the White Mountains for local floristic projects. Eureka, Lander, and Pershing counties are not home to any of the state’s marquee mountain ranges and remain less-explored. Overall, specimen density is still relatively low across the state.
County lines are crude human-made boundaries and bear little correspondence to the habitat variations that drive plant species and community diversity. Nevada’s counties, in particular, are enormous—nine out of seventeen are larger than the state of Connecticut—and tend to vary considerably in elevation, soil type, and other abiotic factors. Although interesting, county-level analysis can’t tell us with much specificity about places that may have been overlooked.
So, using the same dataset and scale, I analyzed specimen density by mountain range and valley in Nevada:
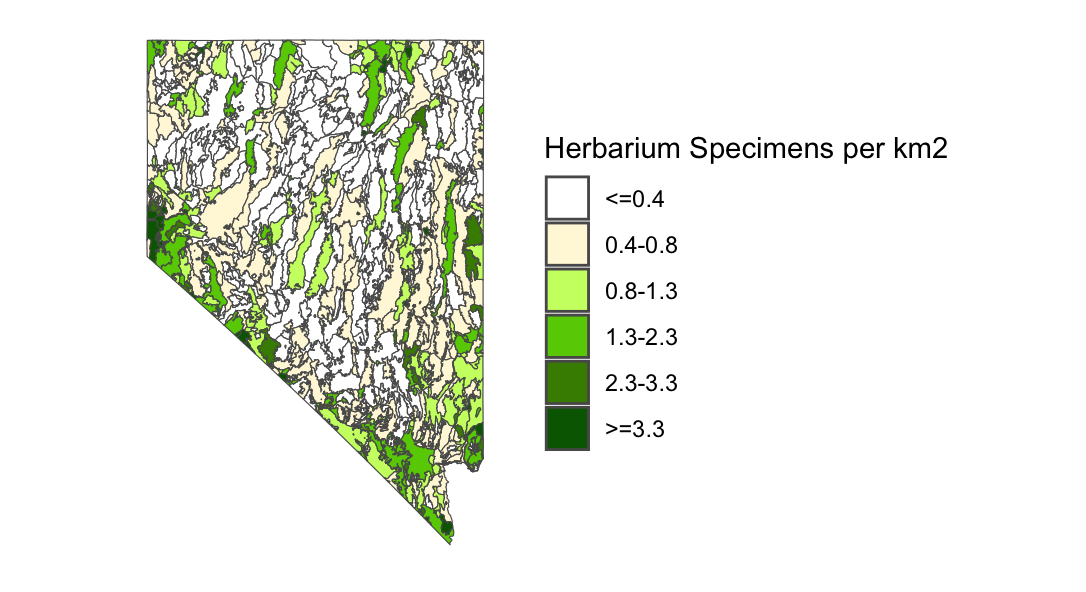
Much of what we inferred from the county map holds true in this figure: the Carson Range, Spring Mountains, Ruby Mountains, and Jarbidge area stand out immediately as better-collected. Other collecting hotspots were, like the Whites and Silver Peaks, the subjects of dedicated floristic efforts. The Gold Butte National Monument flora undertaken by Gentilcore, the Desert National Wildlife Refuge flora by Ackerman, and the Snake Range flora by Clifton are all immediately distinguishable on the map. Local floristic studies are typically limited in geographic and temporal scope, but have an outsize effect on specimen density, and often result in the discovery of species new to a state, county, or mountain range (see, in particular, the introduction to Pipkin 2024).
The contributions made by authors of local floras are invaluable. No discussion of herbarium data from Nevada would be complete, however, without an acknowledgement of Jerry Tiehm’s prolific decades of collecting throughout the state. Using the same datasets from the above figure and splitting out specimens with “Tiehm” in the collector field, I calculated that of the 640 mountain ranges and valleys into which Nevada is divided, Tiehm collections account for >33.3% of specimens in 230 of them, or around 36%. In around half of these 230 features, Tiehm collections account for >50% of the total. This is clearly remarkable, and despite the phenomenon of “mega-collectors” as acknowledged in the literature (e.g. Schmidt et al. 2025), I wouldn’t expect a similar dynamic in most other places.
I’m not interested in rerunning Taylor’s analysis for the entire western United States, but I can’t resist a small amount of cross-border comparison. Here is how specimen density looks within 50 kilometers of the Nevada-California border:
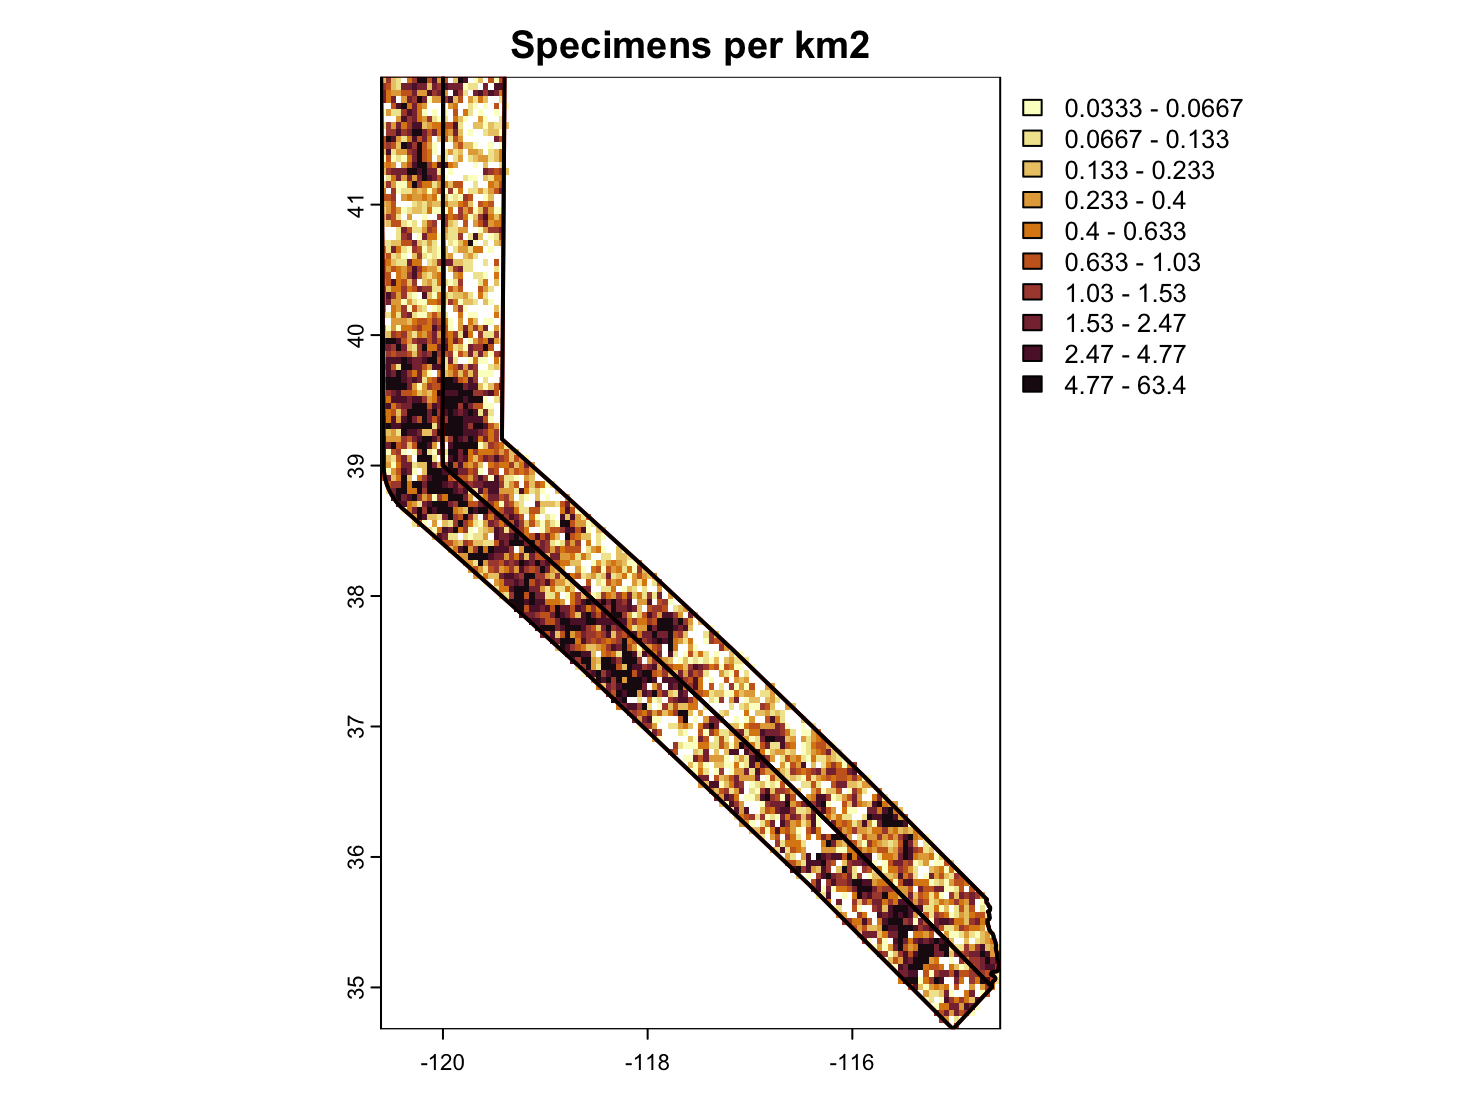
The methodology here differs in several important ways from that used to generate the previous figures. The underlying specimen data were derived from GBIF rather than SEINet, and were filtered to exclude iNaturalist observations (an analysis of iNaturalist observation density would be a worthwhile although somewhat separate topic) and again non-robustly deduplicated. The point data were rasterized to keep the spatial scale consistent. Raster cells have a size of 0.05 x 0.05 decimal degrees, which translates to an area of roughly 30 square kilometers. To obtain the density figure, the number of specimen records per cell was divided by the cell area in square kilometers.
The California side of the border buffer has 145,867 specimen records over an area of 50,324 square kilometers for a density of about 2.9 specimens per square kilometer, while the Nevada side had 62,439 over an area of 46,870 square kilometers for a density of about 1.3 specimens per square kilometer. The California side does include more of the well-collected Sierra Nevada, but it seems clear that even in similar ecosystems with similar expected levels of diversity, the state line forms a powerful barrier keeping botanical interest walled off to the west.
This cross-border comparison demonstrates that a lack of species or ecosystem diversity is not the cause of the under-collection of Nevada. Nevada has 3,647 documented minimum rank taxa and notable diversity in elevation and soils (Tiehm & Nachlinger 2025). A number of state records, including Diplacus rupicola (Novak 212 RSA), Iliamna bakeri (Lowder 4 RENO), and Rosa bridgesii (Tiehm 19934 RENO), as well as an exciting rediscovery of Kyhosia bolanderi (Tiehm 2025) have been documented within this 50 km buffer zone in just the past couple of years.
Why the relative under-collection on our side of the border, then? Much of Nevada is remote from population centers and even from paved roads, and nearly all of it falls within one of two floristic regions, the Great Basin and Mojave Deserts, which may render its biodiversity underrated by both the public and by professional biologists.
Hopefully these figures demonstrate that Nevada still has many botanical discoveries to make, that local floristic studies make meaningful contributions to our understanding of plant diversity, and that we in the NNPS are not condemned to a backwater but instead find ourselves on an exciting frontier. Collaborative and non- or para-professional collecting projects have a history of meaningful discoveries (Ertter 2000), and I hope that we can build this capacity within NNPS.
I’m happy to make the datasets and code underlying these figures available to other NNPS members who may have use for them. Thanks to Chloe Novak and Peri Lee Pipkin for the discussions that led to this article and for thoughtful edits. Correspondence is welcome at psilbey@gmail.com.
Figures and data processing were accomplished with the tidyverse, sf, terra, and rgbif packages in R (Wickham et al. 2019, Pebesma 2018, Hijmans et al. 2026, Chamberlain et al. 2025, R Core Team 2024).
Works Cited
Ackerman, TL (2003). A flora of the Desert National Wildlife Refuge, Nevada. Mentzelia 7: 1-90.
Chamberlain S, Barve V, Mcglinn D, Oldoni D, Desmet P, Geffert L, Ram K (2025). rgbif: Interface to the Global Biodiversity Information Facility API. R package version 3.8.4, https://CRAN.R-project.org/package=rgbif.
Clifton, G (2012). Flora of the north and south Snake Ranges. Unpublished report to the National Park Service. Baker, NV. 180 pp.
Daru, BH, DS Park, RB Primack, CG Willis, DS Barrington, TJS Whitfield, TG Seidler, PW Sweeney, DR Foster, AM Ellison & CC Davis (2017). Widespread sampling biases in herbaria revealed from large-scale digitization. New Phytologist 217:939-955.
Ertter, B (2000). Floristic surprises in North America north of Mexico. Annals of the Missouri Botanic Garden 87(1):81-109.
GBIF (2026). Global Biodiversity Information Facility. Occurrence dataset https://doi.org/10.15468/ab3s5x accessed via GBIF.org on 2026-01-24.
Gentilcore, DM (2019). An annotated checklist of the vascular plants of Gold Butte National Monument, Clark County, Nevada. Chapter 3 in: Mojave Desert Plant Community Long-Term Response to Disturbance. Unpublished Ph.D. dissertation, University of Nevada, Las Vegas: Las Vegas, NV. 185 pp.
Hijmans R, Brown A, Barbosa M (2026). terra: Spatial Data Analysis. R package version 1.8-96, https://github.com/rspatial/terra.
Morefield, J, S Matson & D Neubauer (2025). Working checklist of the vascular flora of the White Mountains, California and Nevada, updated 29 June 2025. 10.13140/RG.2.2.14899.54565.
Pebesma E (2018). Simple Features for R: Standardized Support for Spatial Vector Data. The R Journal, 10(1), 439–446. doi:10.32614/RJ-2018-009, https://doi.org/10.32614/RJ-2018-009.
Pipkin, PL (2024). A floristic inventory of the Silver Peak Range, Esmeralda County, Nevada. Unpublished Master’s thesis, Claremont Graduate University: Claremont, CA.
Schmidt, RJ, KE Saban, L Struwe & CC Davis (2025). The collector practices that shape spatial, temporal, and taxonomic bias in herbaria. New Phytologist 225 https://doi.org/10.1111/nph.70297
SEINet (2025). Biodiversity occurrence data published by: SEINet - AZ/NM Node (accessed through the SEINet - AZ/NM Node Portal, https://swbiodiversity.org/seinet, 2025-12-16).
Taylor, DW (2014). Large inequalities in herbarium specimen density in the western United States. Phytoneuron 2014-53:1-8. 2 June 2014.
Tiehm, A (2025). Kyhosia bolanderi in Nevada. Nevada Native Plant Society Newsletter 51(5):4-6.
Tiehm, A & J Nachlinger (2025). Nevada vascular plants: an annotated checklist of the state’s botanical diversity. BRIT Press: Fort Woth, TX.
Wickham H, Averick M, Bryan J, Chang W, McGowan LD, François R, Grolemund G, Hayes A, Henry L, Hester J, Kuhn M, Pedersen TL, Miller E, Bache SM, Müller K, Ooms J, Robinson D, Seidel DP, Spinu V, Takahashi K, Vaughan D, Wilke C, Woo K & Yutani H (2019). “Welcome to the tidyverse.” Journal of Open Source Software, 4(43), 1686. doi:10.21105/joss.01686.